Occupancy Report
Report on occupancy and Operational Revenue in RMS.
The Occupancy Report is an interactive report that provides statistical insights on occupancy and Operational Revenue for the selected date range.
-
Information
-
Use
- Add Button
Information
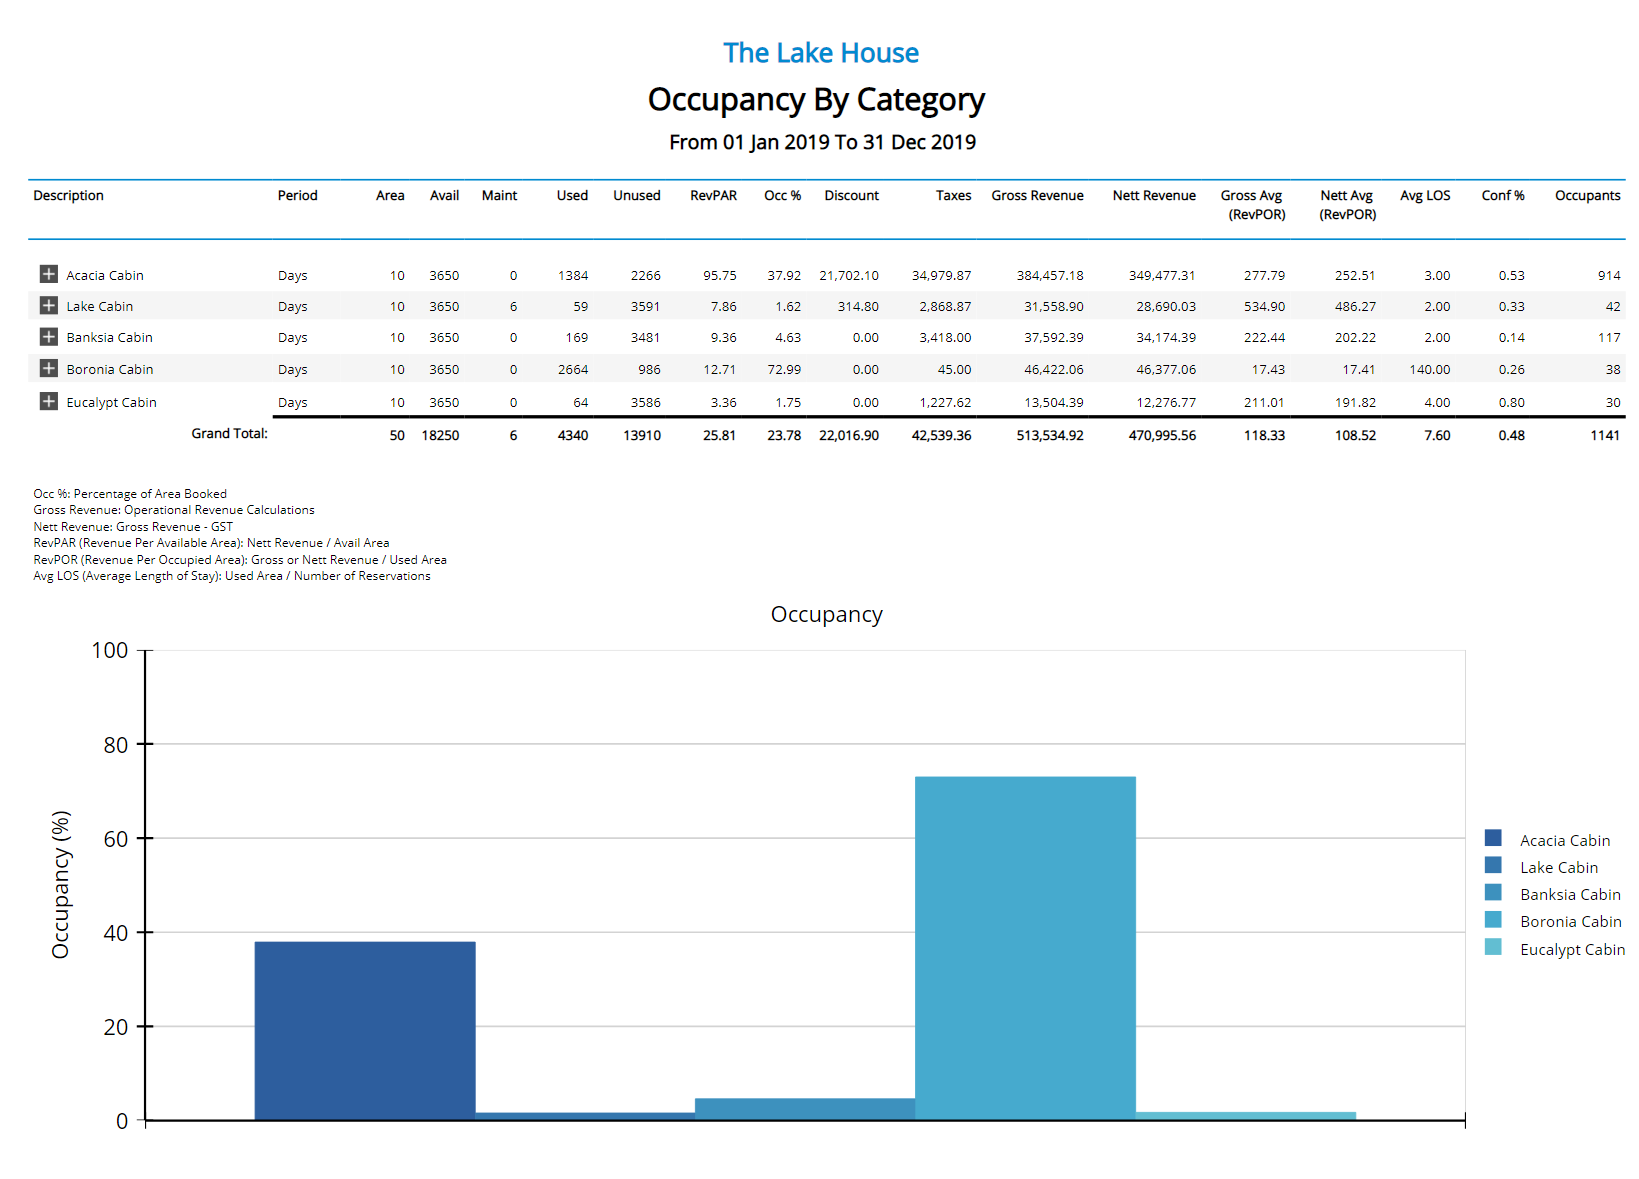
The Occupancy Report is an interactive report that provides statistical insights on occupancy and Operational Revenue for the selected date range.
Operational Revenue and statistics can be reported by Category or as a Daily Breakdown.
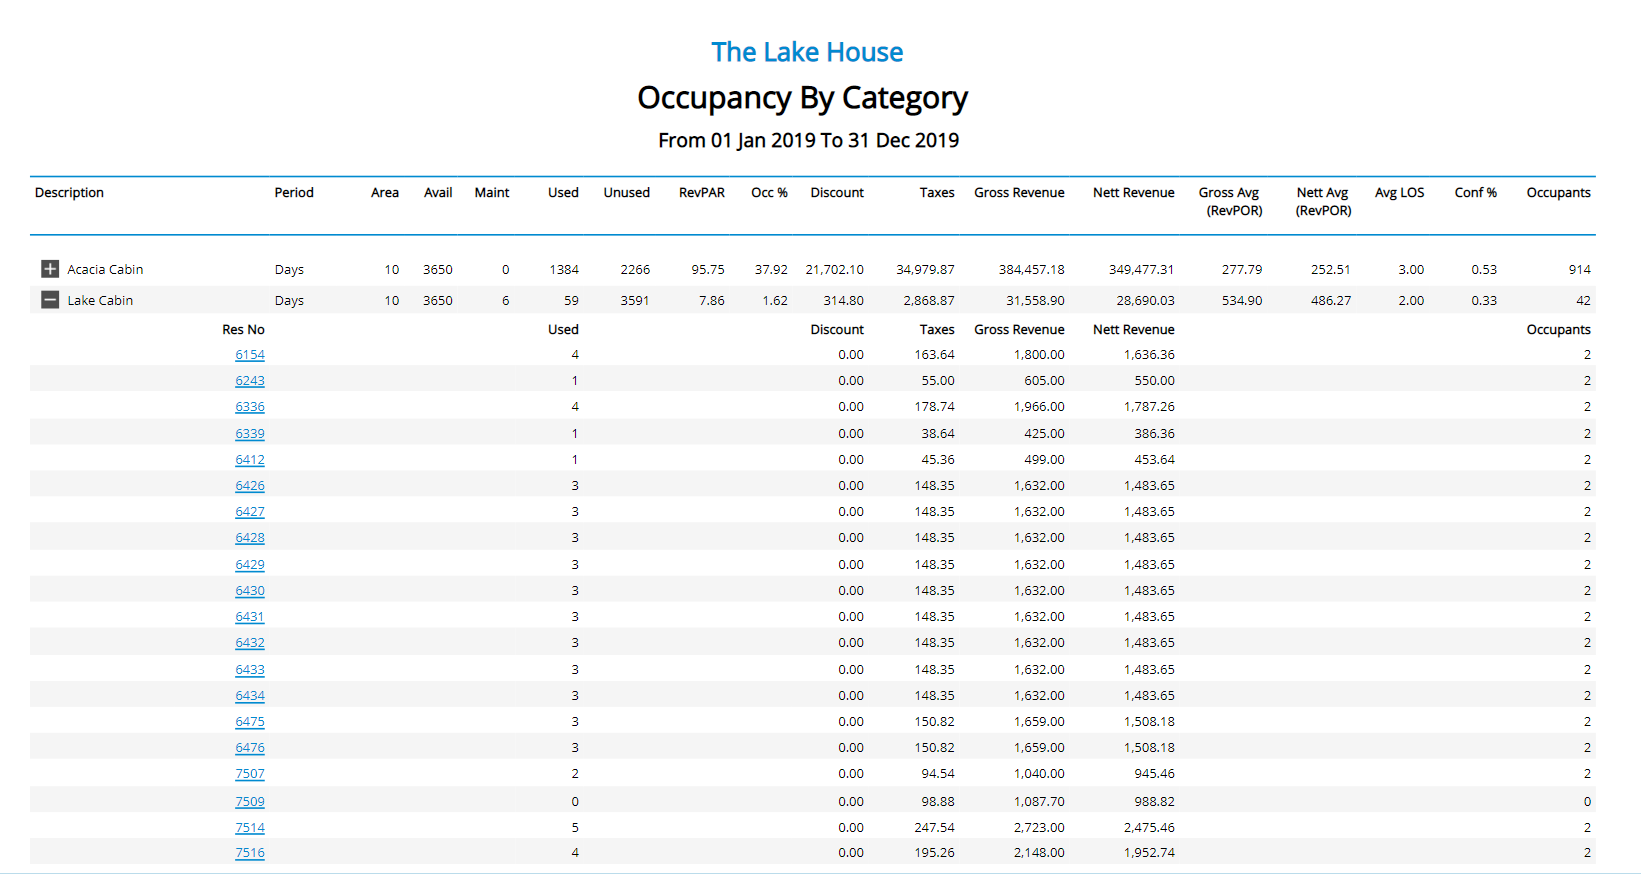
The Category view can be expanded to review all Reservations contributing to the reported totals.
The Occupancy Report includes the following information.
| Report Column | Information |
|---|---|
| Area | Total Available Areas for the Category. |
| Available | Total Available Areas multiplied by the selected date range to determine the Area Nights. 10 Areas x 30 Days = 300 Available |
| Maint | The number of Area Nights where an Area was on Maintenance. |
| Used | The number of Area Nights used by a reservation. |
| Unused | The number of Area Nights not used by a reservation. |
| RevPAR | Revenue Per Available Area is determined by the Nett Revenue divided by the number of Available Areas. |
| Occ % | The percentage of Total Available Areas used for the selected date range. |
| Discount | The value of any Discounts on reservations contributing to the Occupancy Percentage. |
| Taxes | The value of any Taxes on reservations contributing to the Occupancy Percantage. |
| Gross Revenue | The Operational Revenue for all reservations contributing to the Occupancy Percentage. |
| Nett Revenue | The Gross Revenue value less any GST. |
| RevPOR (Gross Avg) | Revenue Per Occupied Area is determined by the Gross Revenue divided by the Total Area Nights Used. |
| RevPOR (Nett Avg) | Revenue Per Occupied Area is determined by the Nett Revenue divided by the Total Area Nights Used. |
| Avg LOS | The Average Length of Stay is determined by the Total Area Nights Used divided by the Total Reservations for the selected date range. |
| Conf % | The percentage of Total Reservations for the selected date range that are or were in 'Confirmed' status prior to their arrival. |
| Occupants | The Total Number of Guests on the Total Reservations for the selected date range. |

Category, Area, Reservation, Guest & Tax are default System Labels that can be customised.

Users will require Security Profile access to view this report.
-
Use
- Add Button
Use
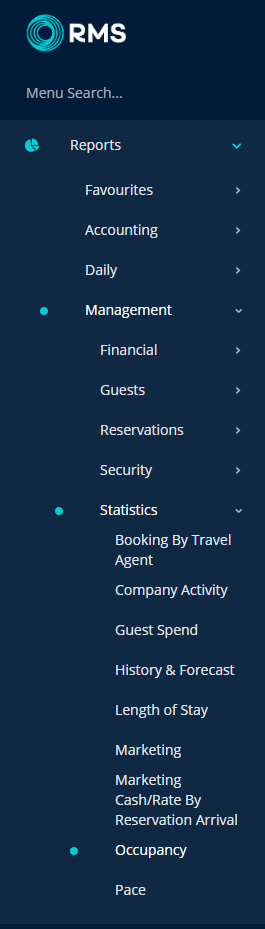
- Go to Reports > Management > Statistics > Occupancy in RMS.
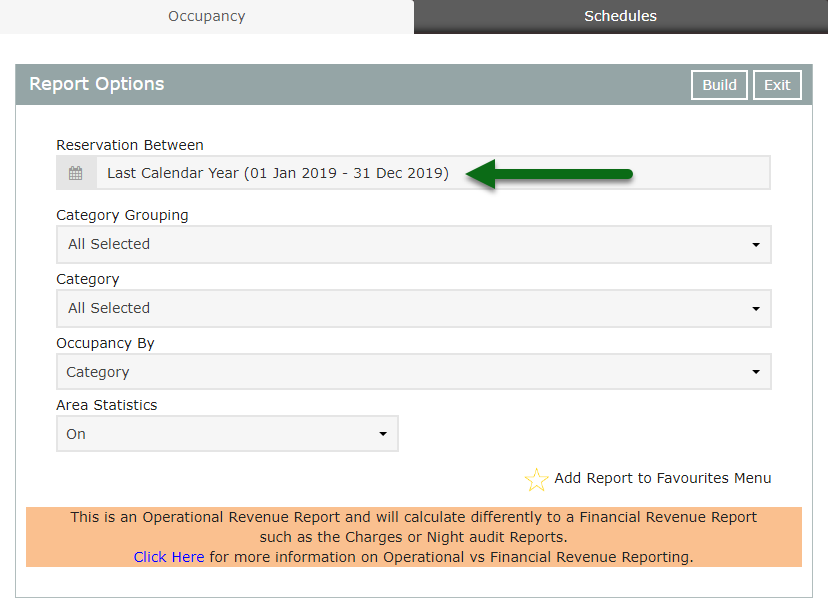
- Select the Date Range.
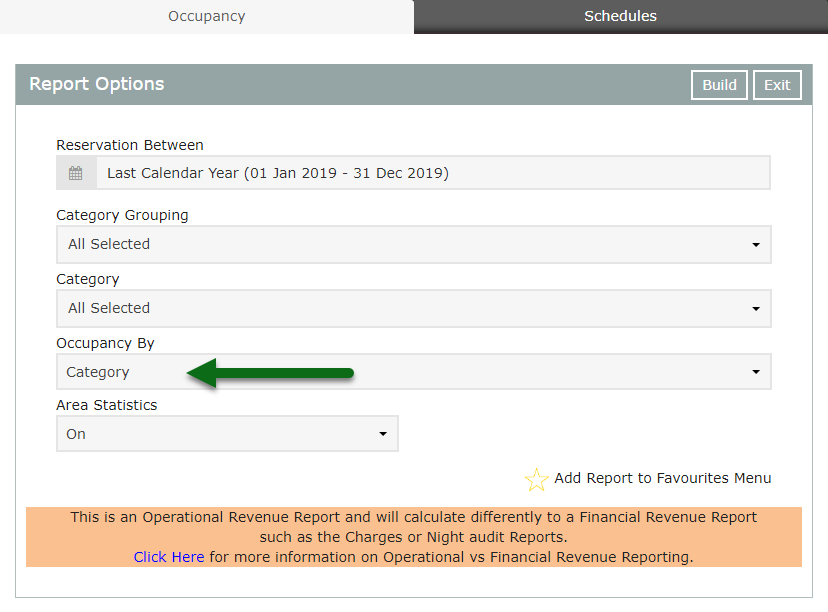
- Select the Occupancy By option.
- Build.

Selecting the option ‘Exclude Complimentary and House Use’ will exclude Complimentary and House Use Reservations from the report.
Selecting the option ‘Daily Breakdown’ displays additional checkboxes ‘Output Reservation Analysis as CSV’ and ‘Show Market Segment Breakdown (CSV Export)’.
Selecting the option ‘Output Reservation Analysis as CSV’ or ‘Show Market Segment Breakdown (CSV Export)’ will export the report data in .csv format.
Select the  icon when viewing the report to expand sections and display more information on the individual reservations contributing to the reported figures. Use the
  icon to collapse the expanded section.
Additional Charge Labels that have been selected to ‘Include in Occupancy Count’ will appear on the Occupancy Report.
Select any reservation number in the expanded report section to go to that reservation in a new tab.
Interactivity is not available on the printed report.
-
Guide
- Add Button
Guide
Go to Reports > Management > Statistics > Occupancy in RMS.
Select the Date Range.
Select the Occupancy By option.
Select 'Build' to generate the report using the selected options.
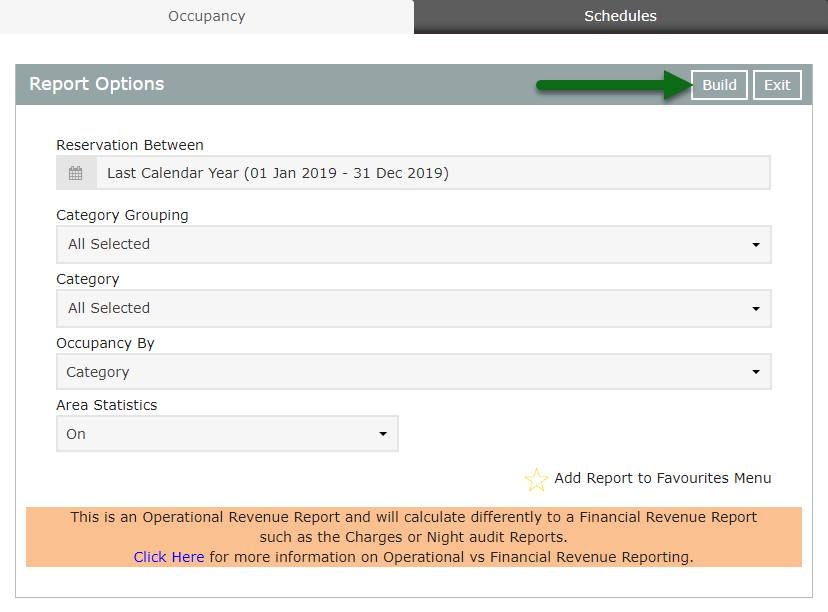
The Occupancy Report will display the statistics and Operational Revenue for the selected date range.
Use
- Go to Reports > Management > Statistics > Occupancy in RMS.
- Select the Date Range.
- Select the Occupancy By option.
- Build.
Selecting the option ‘Exclude Complimentary and House Use’ will exclude Complimentary and House Use Reservations from the report.
Selecting the option ‘Daily Breakdown’ displays additional checkboxes ‘Output Reservation Analysis as CSV’ and ‘Show Market Segment Breakdown (CSV Export)’.
Selecting the option ‘Output Reservation Analysis as CSV’ or ‘Show Market Segment Breakdown (CSV Export)’ will export the report data in .csv format.
Select the  icon when viewing the report to expand sections and display more information on the individual reservations contributing to the reported figures. Use the
  icon to collapse the expanded section.
Additional Charge Labels that have been selected to ‘Include in Occupancy Count’ will appear on the Occupancy Report.
Select any reservation number in the expanded report section to go to that reservation in a new tab.
Interactivity is not available on the printed report.
-
Guide
- Add Button
Guide
Go to Reports > Management > Statistics > Occupancy in RMS.
Select the Date Range.
Select the Occupancy By option.
Select 'Build' to generate the report using the selected options.
The Occupancy Report will display the statistics and Operational Revenue for the selected date range.