Performance II Report
Detailed performance tracking on a variety of subjects with optional year on year comparison in RMS.
-
Information
-
Use
- Add Button
Information
Subjects that can have performance tracked include Companies, Travel Agents, Booking Sources and Market Segments.
The 'Top Performers' option under 'More Options' can be used to view only the specified number of top performing subjects with performance based on revenue, reservations or room nights.
The Performance II report can be used to track performance of individual subjects which could assist with preparing negotiated contracts or identify promotional gaps for the property.

Users will require Security Profile access to view this report.
-
Use
- Add Button
Use
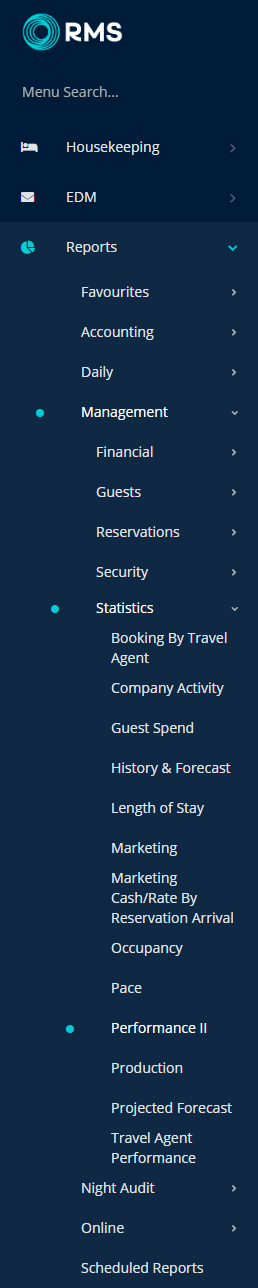
- Go to Reports > Management > Statistics > Performance II in RMS.
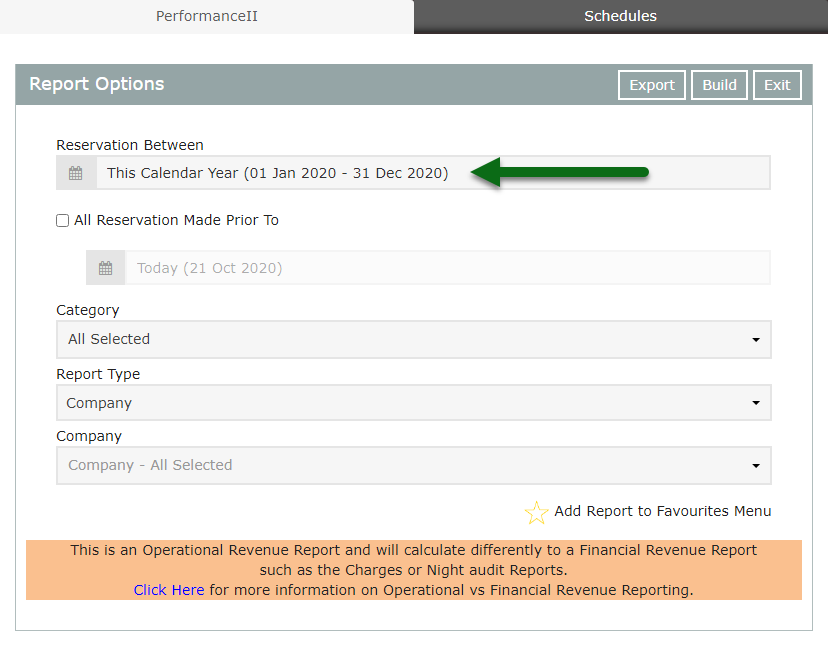
- Select the 'Reservations Between' Date Range.
-
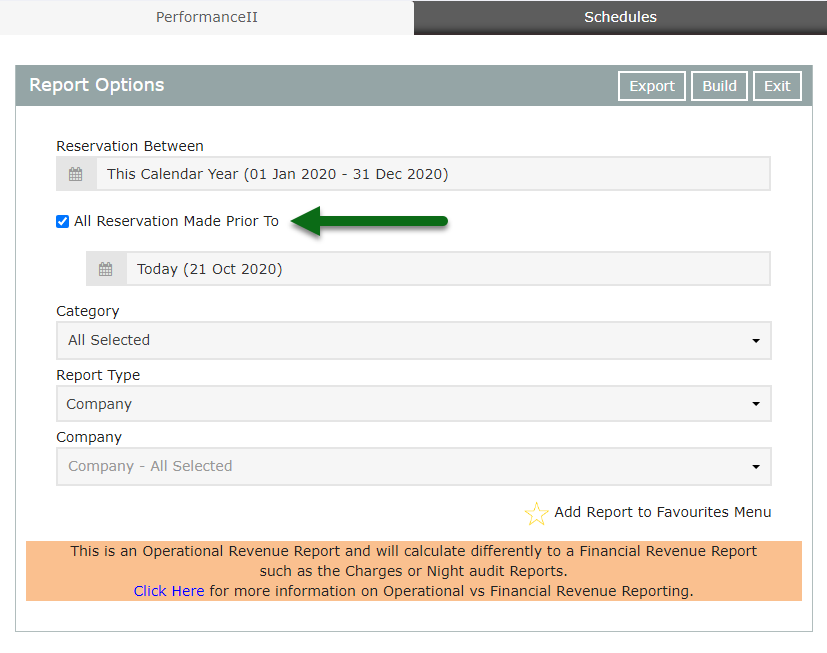
Optional: Select the checkbox 'All Reservation Made Prior To'.
- Select the Date.
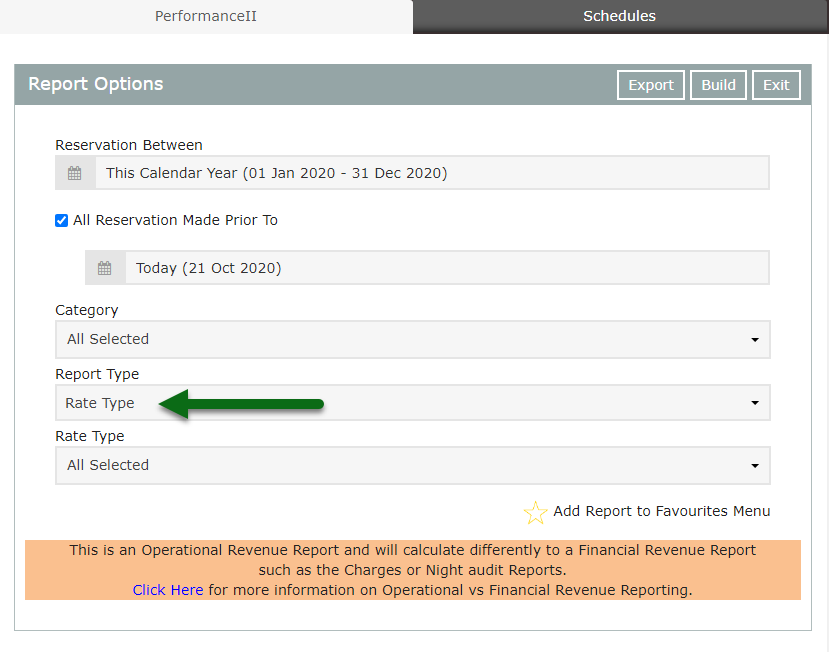
- Select the Report Type.
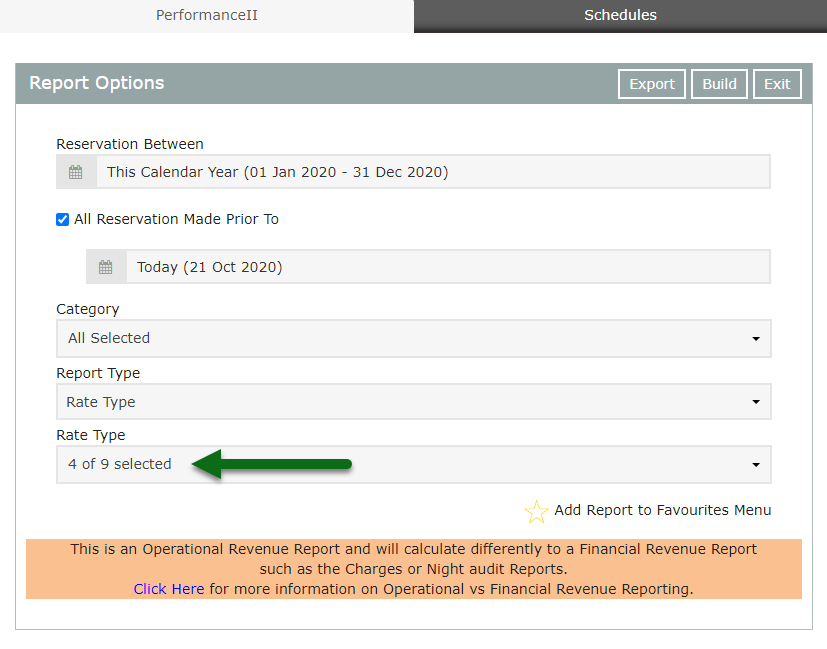
- Optional: Select Individuals.
-
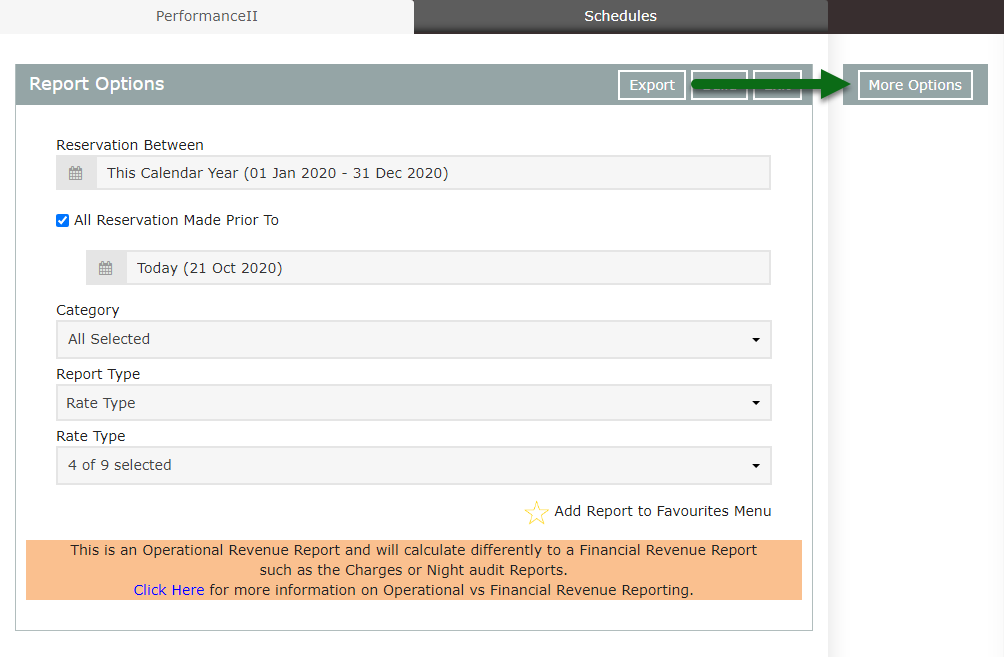
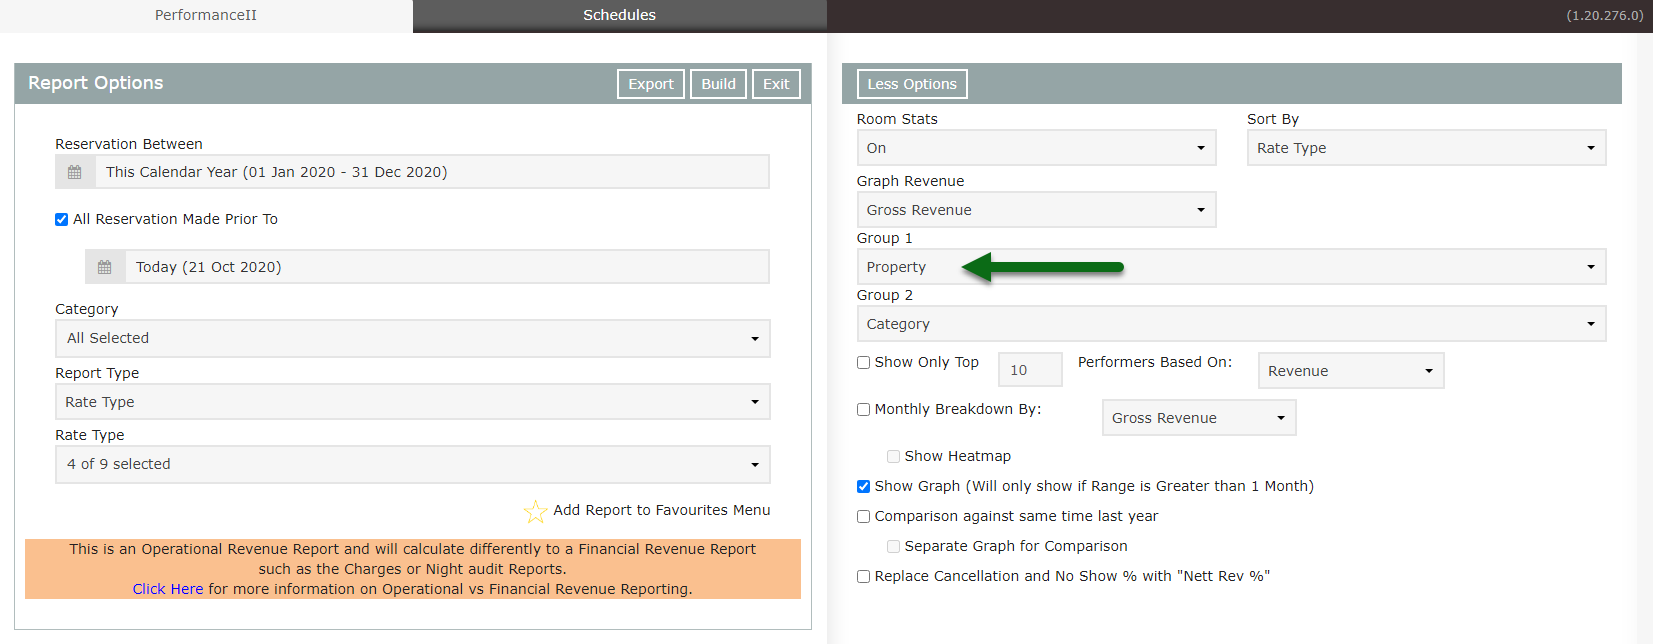
Optional: Select 'More Options'.
- Select the Graph Revenue option.
- Select the Grouping 1 & 2 options.
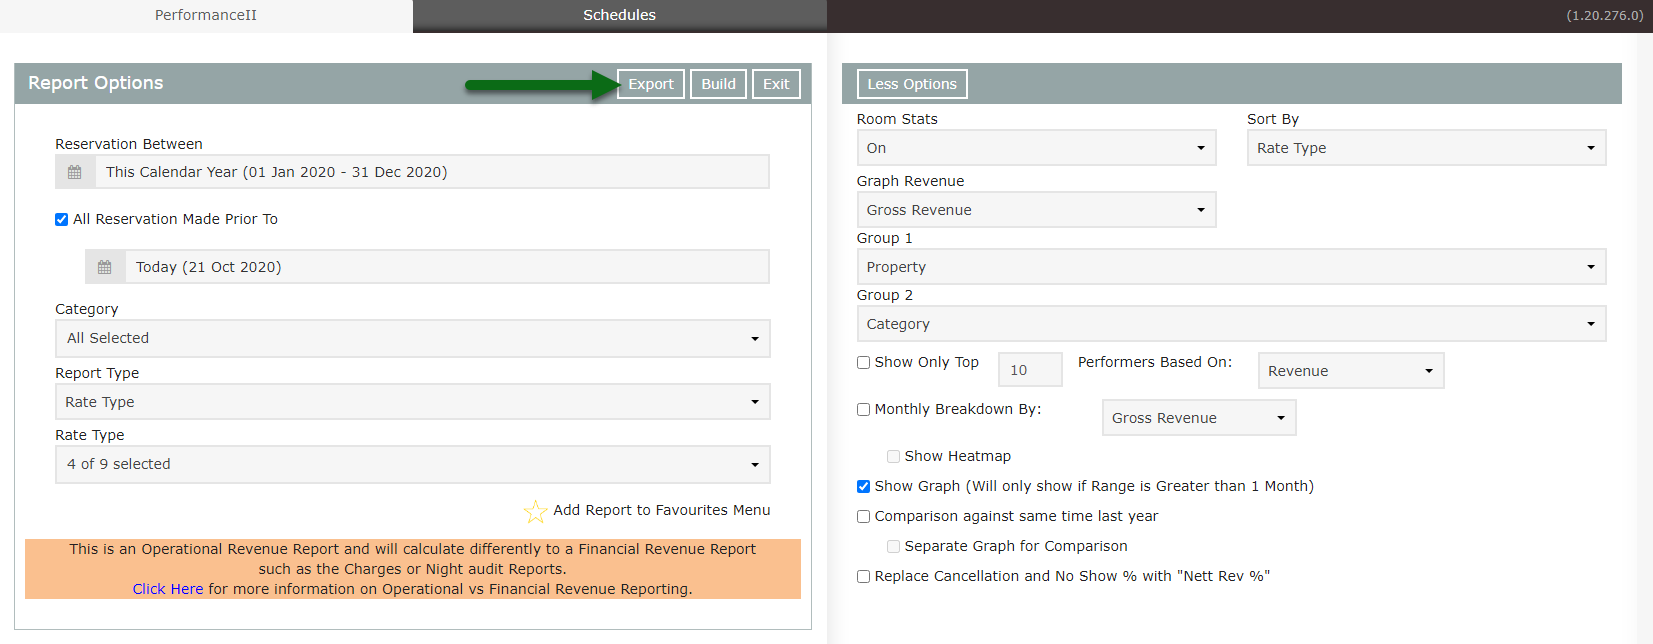
- Export.
-
Guide
- Add Button
Guide
Go to Reports > Management > Statistics > Performance II in RMS.
Select the 'Reservations Between' Date Range.
Optional: Select the checkbox 'All Reservation Made Prior To' and choose a Date.
Select the Report Type.
Optional: Select Individuals.
Optional: Select 'More Options'.
Select the Graph Revenue option.
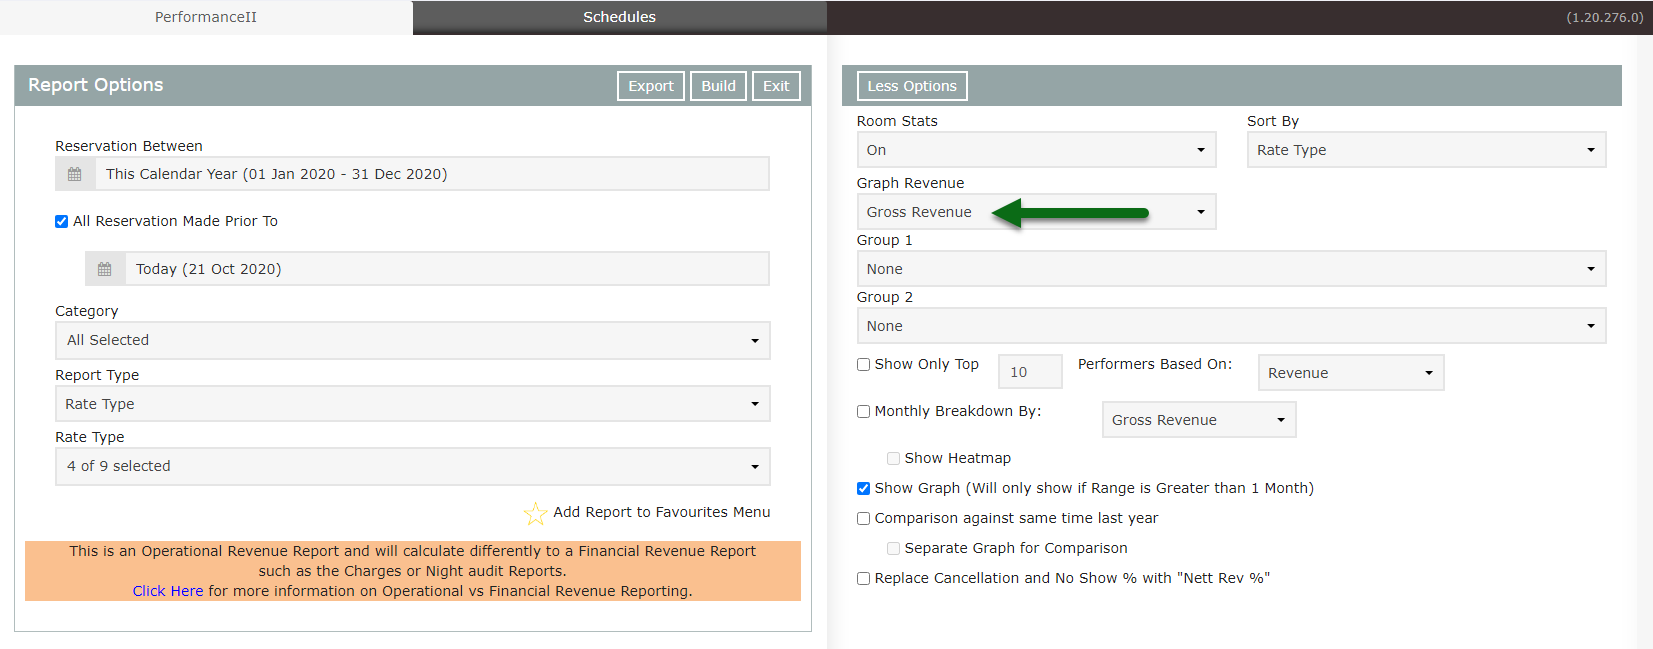
Select the Grouping 1 & 2 options.
Select 'Export' to generate the report using the selected options.
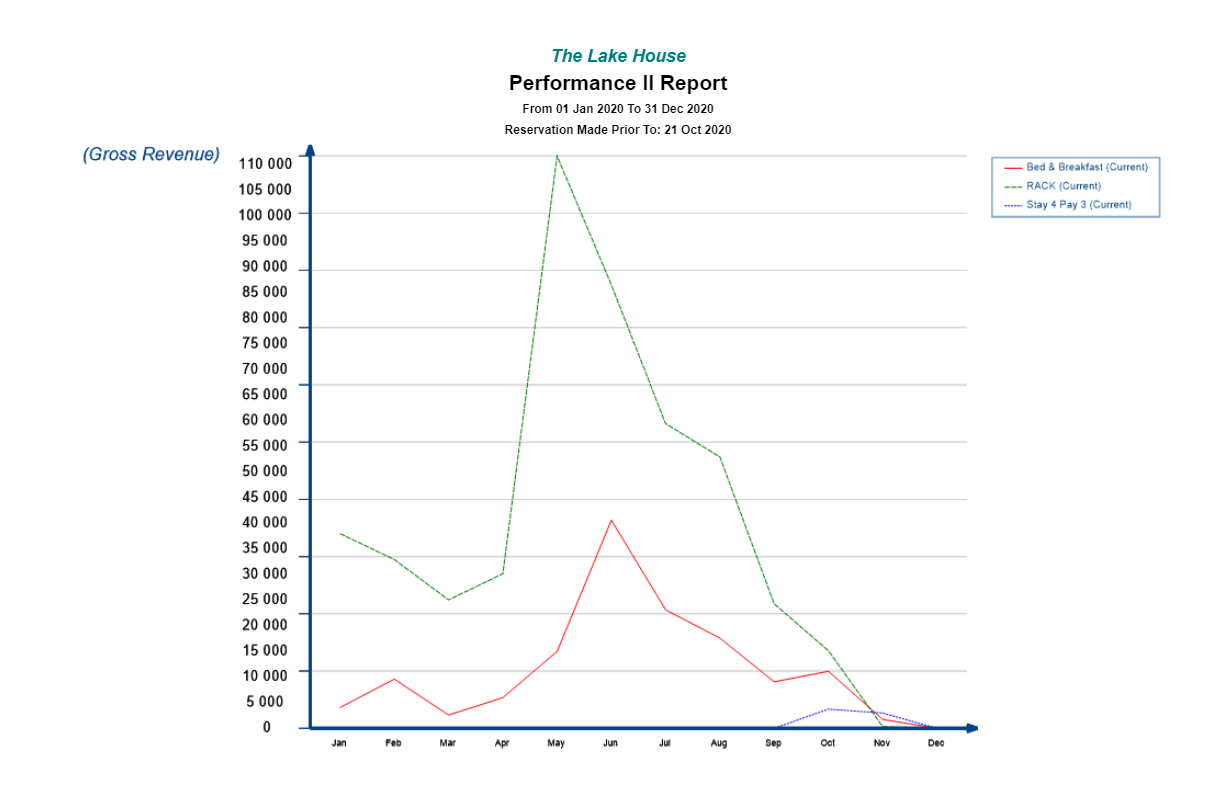
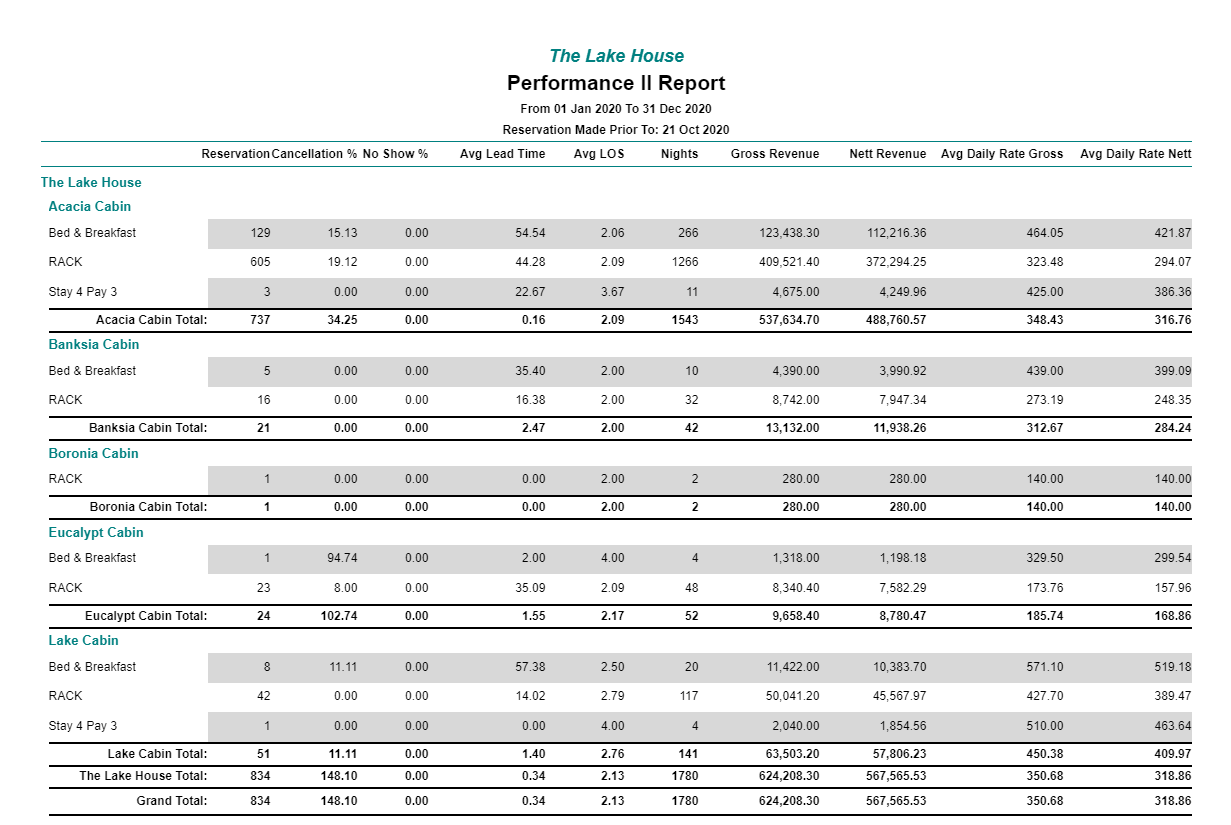
The Performance II report will display the revenue performance by month on a simple line graph and will include a breakdown of reservations, cancellation percentage, no show percentage, average lead time, average length of stay, number of nights, operational revenue and average daily rate.

Use
- Go to Reports > Management > Statistics > Performance II in RMS.
- Select the 'Reservations Between' Date Range.
-
Optional: Select the checkbox 'All Reservation Made Prior To'.
- Select the Date.
- Select the Report Type.
- Optional: Select Individuals.
-
Optional: Select 'More Options'.
- Select the Graph Revenue option.
- Select the Grouping 1 & 2 options.
- Export.
-
Guide
- Add Button
Guide
Go to Reports > Management > Statistics > Performance II in RMS.
Select the 'Reservations Between' Date Range.
Optional: Select the checkbox 'All Reservation Made Prior To' and choose a Date.
Select the Report Type.
Optional: Select Individuals.
Optional: Select 'More Options'.
Select the Graph Revenue option.
Select the Grouping 1 & 2 options.
Select 'Export' to generate the report using the selected options.
The Performance II report will display the revenue performance by month on a simple line graph and will include a breakdown of reservations, cancellation percentage, no show percentage, average lead time, average length of stay, number of nights, operational revenue and average daily rate.